

Summary: Medaptus’ latest Assign release introduces the Hospital Medicine Analytics Dashboard, designed to help hospital medicine programs transform daily assignment data into meaningful insights. The dashboard delivers clear visibility into trends such as patient census, provider workload balance, admissions and discharges, and continuity of care. Built with direct customer feedback, it marks a key step forward in expanding Assign’s value beyond daily management to support data-driven decision-making and operational improvement.
Advancing Assign with Actionable Insights
As part of the recent Assign 25.1 release, we have launched a new analytics feature to enhance visibility for hospital medicine teams — the Hospital Medicine Analytics Dashboard.
This dashboard was designed to give programs better visibility into their daily assignment process. When viewed in aggregate, these insights support strategic decision-making that strengthens provider workflows, enhances patient outcomes, and improves overall program performance.
While most hospitalist programs have access to data through their EHR or internal systems, these tools often lack an assignment-specific perspective. The Assign dashboard fills that gap, connecting directly to operational data that teams rely on each day.
The dashboard represents our ongoing commitment to advancing the Assign platform and creating tools that not only simplify daily workflows but also empower teams to act on the trends that emerge from their own data.
Customer Collaboration Shaping the Dashboard
The development of the Hospital Medicine Analytics Dashboard was shaped by insights from our Customer Advisory Board.. Their ongoing feedback helps ensure this dashboard—and future Medaptus offerings—remain aligned with the evolving needs and priorities of hospitalist programs.
Dashboard Overview: Four Core Reports
The Hospital Medicine Analytics Dashboard delivers four interactive reports that bring assignment data to life through intuitive visuals and filters.
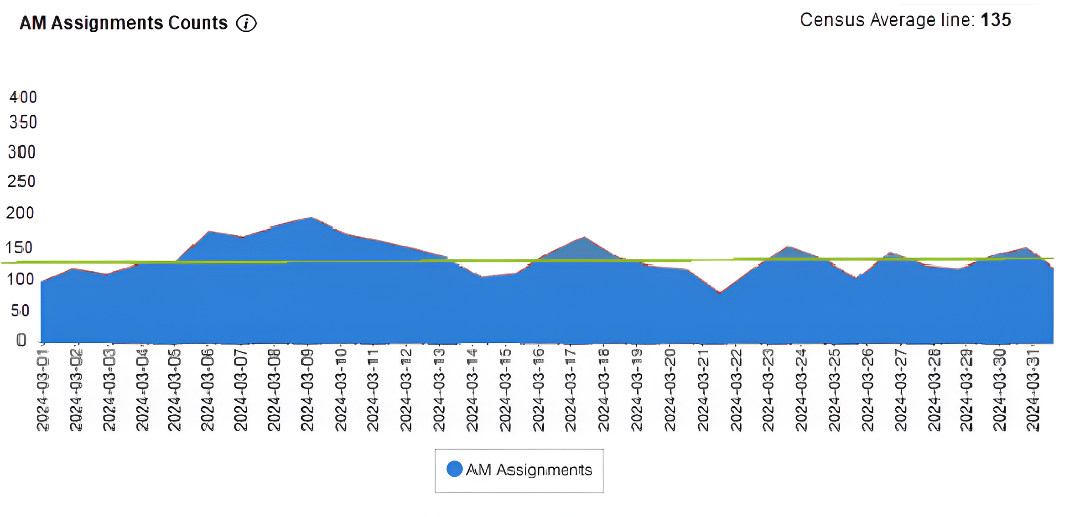
1. Morning Assignment Counts
Displays the daily hospital medicine census — the total number of patients on service each morning. The visual layout makes it easy to identify volume trends over time, including seasonal fluctuations or shifts in patient load. You can select predefined date ranges (month-to-date, quarter-to-date, etc.) or customize their own for deeper trend analysis.
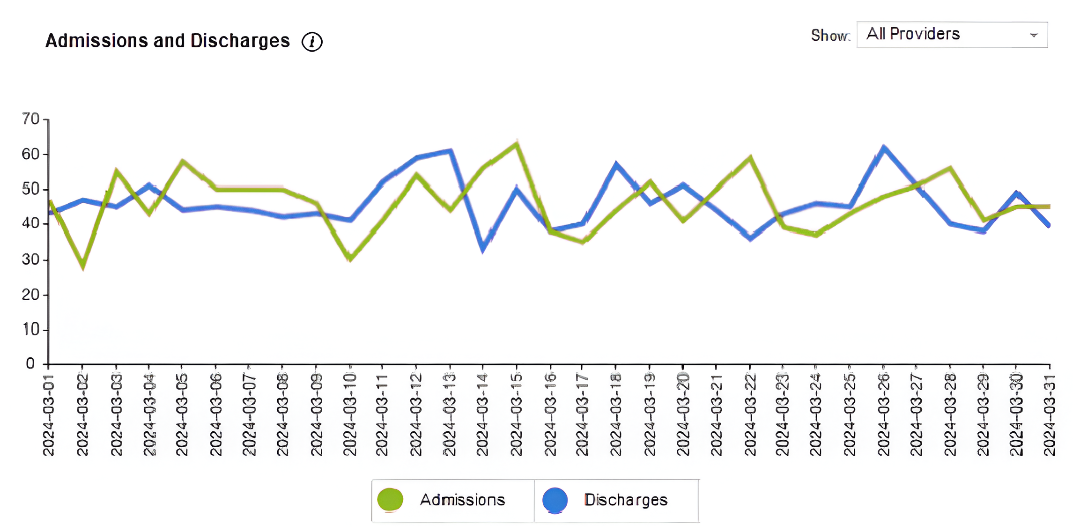
2. Admissions and Discharges
Tracks daily admission and discharge activity side-by-side to highlight patient flow balance. The comparison helps teams determine whether discharges are keeping pace with admissions, supporting more effective bed utilization and patient throughput. A provider filter allows users to drill down to individual performance and workload patterns.
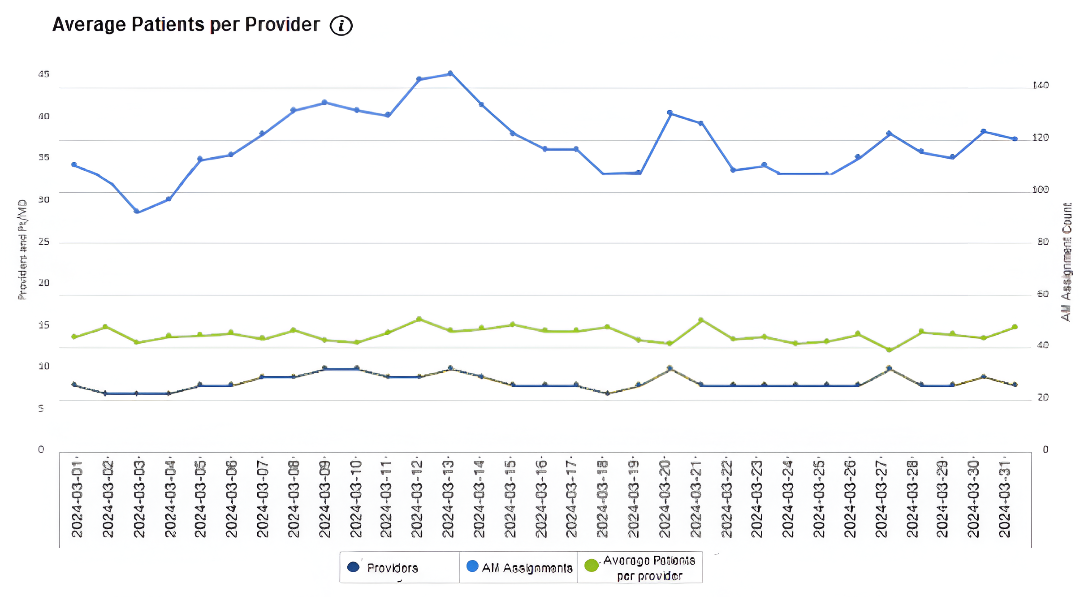
3. Average Patients Per Provider
Combines census data with staffing levels to reveal the average patient load per provider. This visualization helps ensure staffing is aligned with patient demand and supports fair workload distribution. It also provides insight into provider-to-patient ratios that influence care quality and satisfaction.
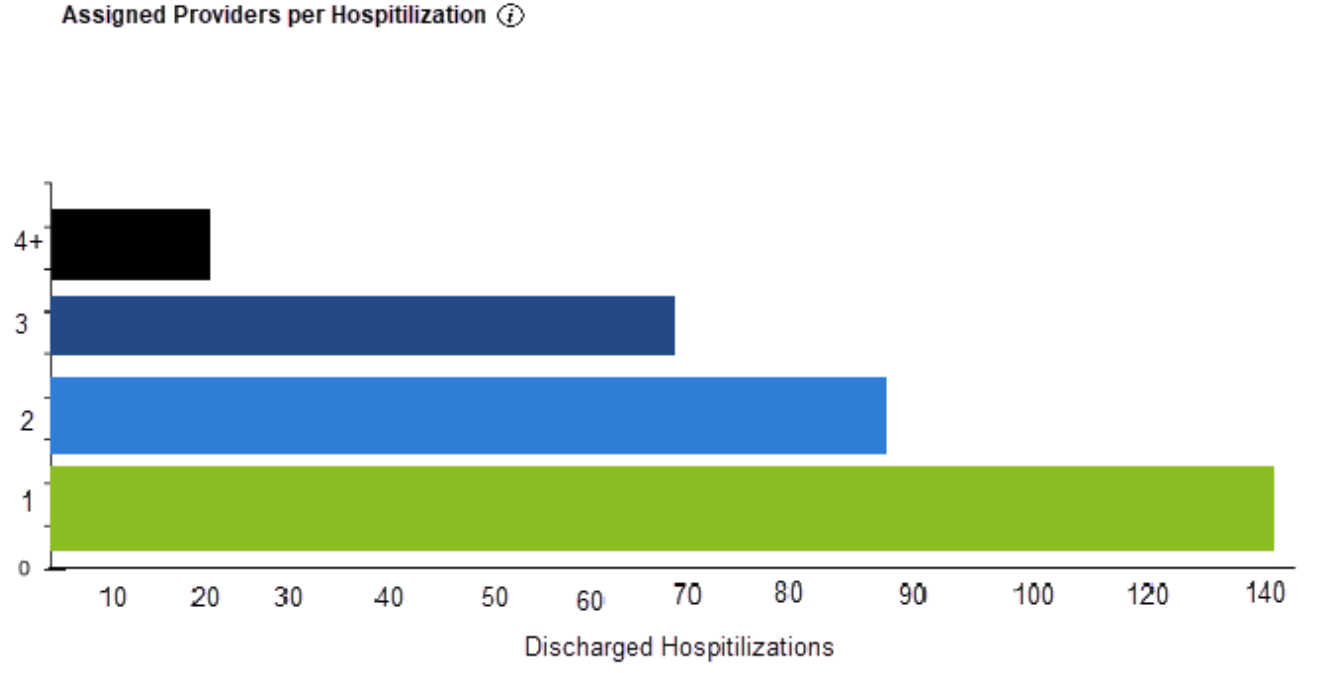
4. Assigned Providers per Hospitalization
Measures continuity of care by showing how many unique providers see a patient during a single hospitalization. Fewer handoffs generally indicate stronger communication and smoother care transitions, while higher counts may correlate with longer lengths of stay. This report helps teams assess provider consistency and identify opportunities to improve care continuity.
Collaborative Rollout and Continuous Improvement
The new dashboard is being enabled on a customer-by-customer basis, allowing us to work directly with each organization during rollout.
We’re also eager to get your feedback to help share future versions of our Analytics suite. If you’d like to have this new feature enabled, contact us here.
Looking Ahead: What’s Next for Assign
In addition to the Hospital Medicine Analytics Dashboard, Medaptus is developing a new module that focuses on streamlining post-assignment workflows. What we hear from our customers is that after they run Assign, they like to email a summary of the daily assignments to all providers and the care team. Rather than manually compiling the data or taking screenshots from Assign, we’ve developed a new distribution report that summarizes your assignment changes, outlines key details your providers need to know (for example, number of new H&Ps per provider) and carries over important notes for each patient. This feature will further reduce the manual work involved in getting updated assignment information to care teams, allowing hospitalists to round on time and ensuring care teams are informed of changes.
Together, these initiatives reinforce Assign’s role as a comprehensive platform for automated patient assignments and performance visibility.
We’re excited to continue developing new solutions that support hospital medicine teams to focus on patient care, and look forward to an exciting year ahead – working together to improve hospital medicine!
FAQs
Q: Who can access the Hospital Medicine Analytics Dashboard?
A: The dashboard is included in the latest Assign release and will be activated individually for each organization. Contact Medaptus to get it turned on for your team.
Q: Why did you choose to focus on these four reports to start?
A: These reports represent the metrics hospital medicine leaders rely on most to manage daily operations — patient volume, provider workload, throughput, and continuity of care. They serve as the foundation for expanded analytics capabilities in future releases.
Q: If I have other metrics that are important to my organization, do you offer custom reports?
A: Yes. The next phase of the dashboard will include additional reports, but if your organization needs specific analytics sooner, Medaptus can develop custom reports tailored to your needs. Book a call here to discuss options.
Q: How do I use the analytics tool?
A: Simply reach out to Medaptus to have it enabled for your organization. Once activated, your team will receive guidance on accessing and interpreting the dashboard data.
Q: Can the dashboard be customized?
A: The initial release includes four core reports. Future versions will include more flexibility and customization based on user feedback and data needs.
Get the latest updates and news delivered to your inbox.
Subscribe to our newsletter today.