

The next metric in our ongoing series about hospitalist data and program management has to do with the financial health of your group. Whether you collect your own charges, or the hospital collects them for you, the amount of revenue you generate from your practice is a key component to the success of your program (either it’s money in your pocket, or it’s money the hospital collects that helps them feel like they’re getting value out of your program). One of the ways you can understand what your docs are doing, and potentially identify trouble spots, is by looking at the E&M distribution of your docs – which billing codes are they using for which services.
We all have our practice patterns – what we do, what we document, and what we charge. The important thing to note here is that not all docs practice the same way. If you look at the different docs in you group, you may see vastly different practice patterns. One of the places you can see this is in the E&M distribution. Let’s take subsequent visits as an example.
For an subsequent visit, there are three possible charges, level 1, 2, or 3 (we’ll leave out critical care for now). One way to better understand what your docs are doing is to look at the distribution. How many 1s, 2s, and 3s are there for your whole practice? What about on the individual doc level? How do these individual docs differ from your practice as a whole? What about compared to regional or national averages? According to codingintel, current data shows hospitalists are billing 3.5% level 1, 53.3% level 2, and 43.1% level 3 for subsequent encounters.
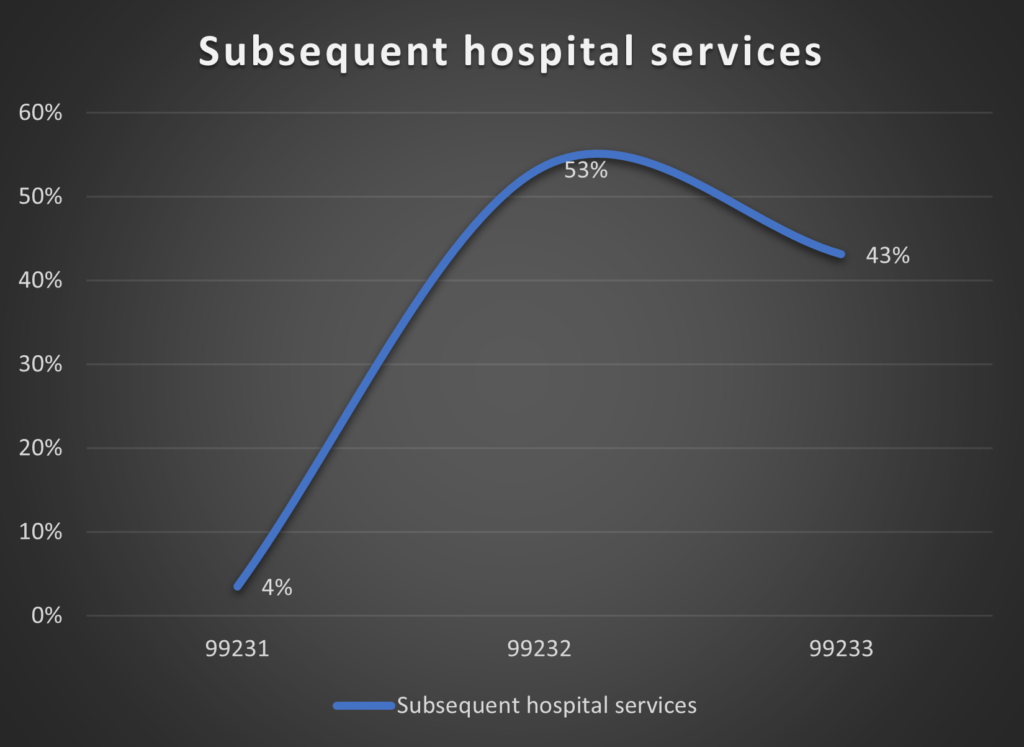
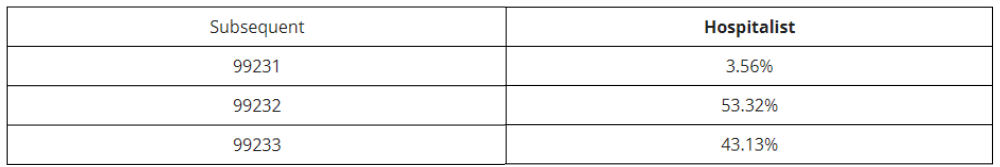
Subsequent hospital services, 99231—99233
The data above is from 2019.
(BTW, while we’re talking about subsequent encounters, if you want to look at initial inpatient visits, then you’re looking at 4% level 1, 20% level 2, and 77% level 3.)
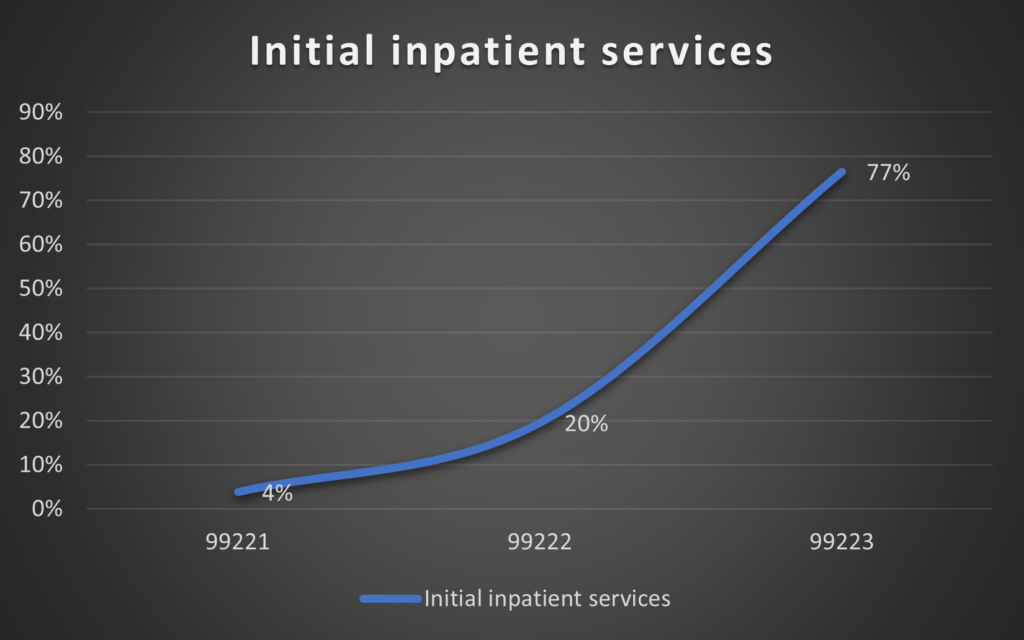
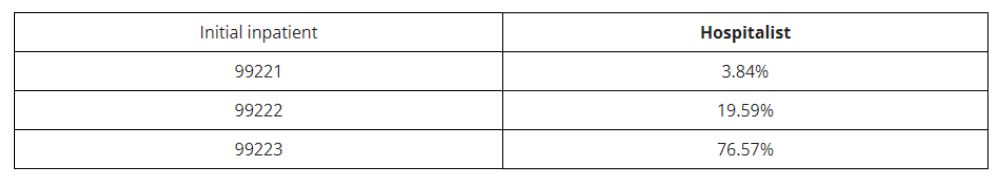 Initial inpatient services, 99221–99223
The data above is from 2019.
Now these are national numbers, and maybe your community is different. You can use this nationwide distribution for comparison, or the distribution from your whole practice to then identify outliers in your group compared to your group baseline. But looking at this lets you look at your docs and identify outliers for further evaluation. Maybe you have a doc who is billing 100% level 2 subsequent visits. Maybe you have a doc that is billing 75% level 3 and 25% level 2 subsequent visits. It’s possible that their billing actually matches their documentation, but perhaps it doesn’t. Maybe they’re underbilling their services (that doc with 100% level 2, may have documented enough to bill level 3, but just didn’t bill that way), or maybe they’re overbilling (maybe that other doc’s 75% level 3 bills don’t have appropriate documentation to support it). But either way it’s something that needs to be looked at so you can take appropriate action – more education, concurrent review prior to billing, documentation audits, etc. . .
By providing education on documentation, and then reviewing the data from your docs re their charge distribution, you can make sure you’re collecting all of the revenue you deserve, and you’re not putting yourself at risk for compliance violations and claw backs of revenues you’ve already received. This is the power of monitoring E&M distribution.
Next time let’s talk about measures of continuity.
Read Part 1 of the Hospitalist Metrics Blog Series: Measuring Length of Stay for Hospitalists
References: https://codingintel.com/em-frequency-data-for-hospitalists/
Get the latest updates and news delivered to your inbox.
Subscribe to our newsletter today.