

Is your charge reconciliation process configured the right way to capture all the revenue that’s available? Are you receiving too many insurance denials? What does your charge lag look like? Are charges filed in a timely manner? Are your doctors submitting charges too late, causing delays in insurance reimbursement? How do you compare against the benchmarks?
As we progress through another year, it’s a great time to review your key revenue management data and analyze how you’re faring on key metrics, and the top opportunities for improvement this year and beyond. Today, we’re looking at three key metrics: lag trends, E&M, and insurance denials.
1. Lag Trends
Lag Time (date of service to date of encounter export) is a great indicator of how efficient your revenue management and reconciliation process is (in our platform, Charge Pro, the lag time metric would help you identify how efficient your workflows are and which can be improved). A great benchmark to strive for is under three days – our highest performing customers get their charges submitted and exported out of medaptus’ Charge Pro within three days of the patient’s date of service.
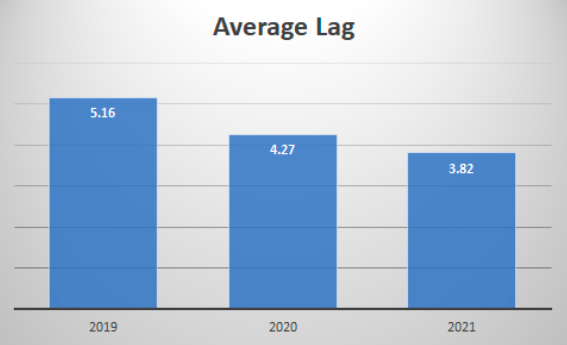 An example of a medaptus customer’s average lag trending downward year over year.
If your organization’s lag time is above three days, it indicates that there may be a bottleneck delaying the revenue cycle process. That’s when you need to “peel back the onion” to dive into specific specialties and even down to the provider and coder level. Once the most impactful opportunity areas are identified, we recommend job shadowing/workflow review sessions with our subject matter experts to pinpoint the exact cause of high lag times and allow the team to implement new processes, re-train, etc. to help reduce lag time.
By helping you understand why you’re not meeting that benchmark, what the root causes are, and how to fix them, you should see an immediate increase in cash acceleration, reduction in denials due to improved coding accuracy, and a more efficient process overall.
2. E&M
You could be leaving money on the table if your physicians are under coding (I.e. billing a level two when the service they provided would qualify as a level three), or getting too many insurance denials and compliance audits when physicians are over coding (billing a higher level that isn’t justified). That’s why it’s key to analyze your E&M distribution.
An E&M Distribution report, like the one in our Charge Pro system, allows our customers to monitor their organization’s evaluation and management coding levels to ensure accuracy and compliance.
Looking at your E&M distribution allows you to easily pinpoint outliers who may be over coding and/or under coding. Our reporting allows organizations to view this data at the hospital level and then pinpoint down to specialty/physician level, where needed. Then you know exactly which group to focus on, for extra training and support.
3. Insurance Denials
Understanding the top denial reasons from your billing system is imperative to having a streamlined revenue cycle. If your organization can pinpoint the top five denial reasons that make up 80% of the denials, you can save your coders a lot of time and effort.
The industry average for denial rates is between 5%-10%. Although you always want it to be lower due to back and forth with insurance companies; timely filing can become an issue if there are delays. The lower the denial rates, the healthier the cash flow is. However, the COVID-19 pandemic, among other factors had increased the average hospital claim denial up to 23% during the year 2020, reported by Change Healthcare. The analysis looked at $407 billion in total charges in over 1,500 hospitals in the United States. In fact, the analysis tells us that 86% of claims denials processed between July 2019 & July 2020 could have been avoidable. This would mean that the hospital could have done something to prevent the denials. The top two claim denial reasons during 2020 were “service was not a covered service” and “missing information.”
These are issues medaptus takes pride in helping with. From catching missing info before it goes through insurance, to making sure the provider billed correctly, we will be there every step of the way. Our Charge Pro system can partner with your coding team to create custom rule logic to catch these encounters before they are sent to your organization’s billing system.
As you can imagine, denials can cause a real headache when trying to get claims out the door and paid in an efficient manner. Catching and correcting denials before they are sent is the most effective way to keep a healthy revenue cycle process.
Analyzing Your Benchmarks and the Impact on Revenue
With our busy everyday roles, it can be difficult to find the time to drill into these metrics and understand the biggest opportunities to focus on, and the estimated impact it will have on your hospital revenue. As we kick off the year, it’s a perfect time to spend some time looking into these key metrics and how you compare to the benchmarks, so you can start identifying improvements to your revenue management process.
The end result: Reduced lag time, faster cash acceleration, and fewer insurance denials – while also equipping your staff to better understand how to charge properly for the services they’re rightfully delivering.
References
- https://revcycleintelligence.com/news/hospital-claim-denials-steadily-rising-increasing-23-in-2020
- https://www.kff.org/private-insurance/issue-brief/claims-denials-and-appeals-in-aca-marketplace-plans/
Author
Dave Corbett
Sr. Director, Customer Success
Get the latest updates and news delivered to your inbox.
Subscribe to our newsletter today.