










Blog Summary
Many hospitalists default to 99232 because it feels safe. Under the 2023 rules, much of that work supports a 99233, or even critical care. Lisa Krueger shows how to find the gap using two views: work RVUs per encounter tracked monthly, and each provider’s E/M distribution compared with peers, the hospital’s case mix and CMS national data. With the 2026 fee schedule expected to cut hospitalist revenue by 5% to 7%, the post explains how to turn those numbers into a short, compliant coaching list. It also shows how Charge Pro’s E/M Distribution report surfaces the pattern.
By Lisa Krueger
In the first post in this series, I quoted a billing leader describing how hospital-based providers used to track their work: a note on a face sheet that said “I did a 99232 today.” Most groups have moved past the paper, but the code in that sentence is still worth a closer look. In hospital medicine, 99232 is the moderate subsequent visit, and for many providers it has become the default.
A lot of providers choose a moderate level because it feels safe. They aren’t trying to underbill. They’re busy, they’re moving to the next patient, and they don’t go back through the note to see whether it supported more. Hospital medicine revenue rests almost entirely on E/M levels, so that habit, repeated across every provider and every rounding day, adds up to real revenue for work your group already did and documented.
Why the safe middle usually means underbilling
In my experience, hospital medicine providers are more likely to be under- than overbilling. Patient acuity keeps rising, and EHR documentation is thorough. Since 2023, providers can select hospital inpatient and observation visit levels by medical decision making or by total time on the date of service. For subsequent visits, 35 minutes supports a 99232 and 50 minutes supports a 99233. A hospitalist managing a complex, deteriorating patient can reach that higher threshold without noticing.
Many providers are still unsure how the 2023 rules apply, and when in doubt, 99232 feels safe. The result is an opportunity: revenue for work already done and documented, without adding staff.
What the gap between levels is worth
These are the 2026 Medicare work RVUs for the codes hospitalists bill most:
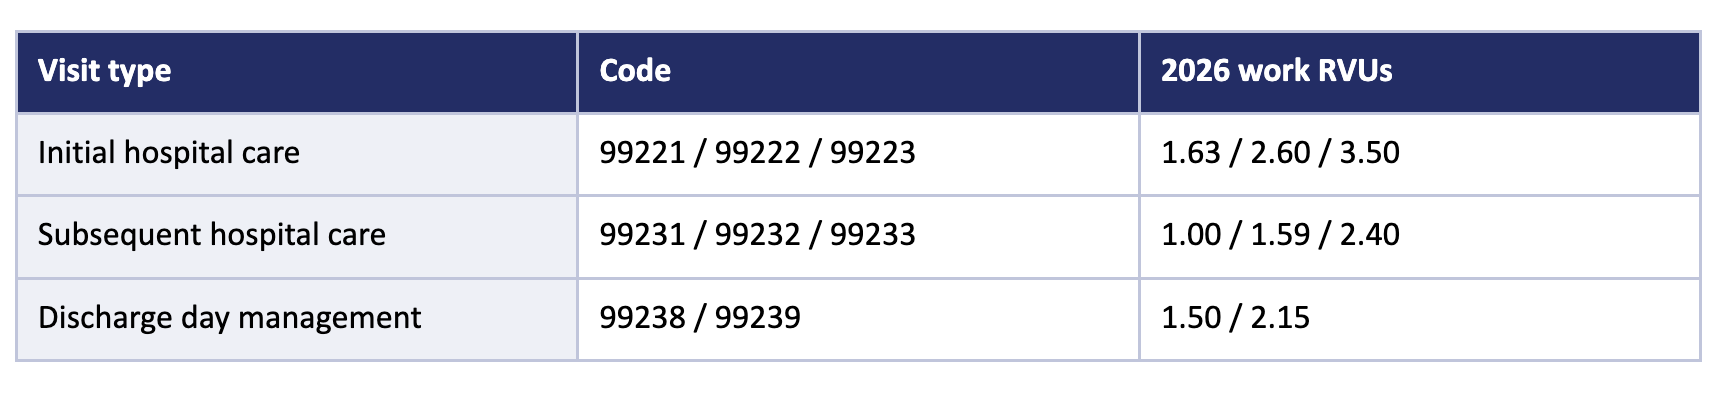
A 99233 carries 0.81 more work RVUs than a 99232. Here is an illustration of how that adds up. Say a group bills 5,000 subsequent visits a month, and 10% of them, 500 visits, were documented to support a 99233 but billed as a 99232. That is 500 × 0.81 = 405 work RVUs a month, or about 4,860 a year. Run the same math with your own visit volume and whatever share your chart reviews suggest. If your providers’ compensation is tied to work RVUs, the gap shows up in their pay as well as the group’s revenue.
The critical care visit that gets billed as a follow-up
One of the largest misses is an encounter that met critical care criteria and was billed as a routine subsequent visit. Critical care applies when a patient has acute impairment of one or more vital organ systems with a high probability of imminent or life-threatening deterioration, and the provider spends at least 30 minutes on that care on the date of service. Location doesn’t define it: a patient in the ICU doesn’t automatically qualify, and a patient on a medical floor can.
CPT 99291, the first 30 to 74 minutes of critical care, carries 4.50 work RVUs in 2026, compared with 2.40 for a 99233. When a hospitalist spends the time stabilizing a deteriorating patient and bills a follow-up, the group loses most of the value of that work. This is actually an education issue, and it’s one of the first things I’d cover with providers.
Why this matters more in 2026
The 2026 Medicare Physician Fee Schedule raised the conversion factor 3.26%, to $33.4009 for most clinicians. It also applied a −2.5% efficiency adjustment to non-time-based services; time-based codes, including E/M visits, were exempt. But CMS reduced indirect practice expenses for services performed in facility settings, which is where hospitalists work. Ventra Health estimates the net effect will reduce hospitalist revenue by 5% to 7%, depending on each group’s mix of procedures and E/M codes. With less room to absorb that, coding accuracy carries more weight.
View 1: work RVUs per encounter, month over month
The first view I’d look at is average work RVUs per encounter, tracked monthly for each provider. It is a single number that summarizes the whole distribution, which makes it easy to trend. A steady decline, or a provider consistently below peers with a similar patient mix, is a signal to look closer.
Before judging the number, know what to expect. The hospital’s case mix index (CMI), the average relative weight of its inpatient DRGs, is a useful guide to how sick its patients are. Hospitalists at a high-CMI hospital should generally show a higher wRVU per encounter and more high-level admissions and follow-ups than a group at a lower-CMI hospital. Ask each hospital’s finance or quality team for its CMI, and use it to set a target wRVU per encounter and E/M distribution for each site.
Watch it over several months rather than reacting to one. A single month can reflect a short schedule, a run of discharges or an unusual patient mix.
View 2: CPT distribution by provider
The second view is each provider’s distribution across levels: what share of their subsequent visits were billed as 99231, 99232 and 99233, and the same for admissions (99221–99223) and discharges (99238–99239). A chart of those shares, provider by provider, shows quickly who bills low-to-moderate much more often than peers.
Compare first against peers in your own group who see similar patients on similar schedules, and against the target you set from the hospital’s case mix index. Those comparisons are the most reliable, because they control for your patient population and your documentation habits. Then compare against national figures. In CMS’s Medicare Part B E/M data for 2025, hospitalists billed 48.5% of follow-up visits as 99232 and 48.7% as 99233, and 74.9% of admissions as 99223.
When one group ran this comparison for two of its hospitalists, one had billed 99222 on 101 of 102 admissions and 99232 on 94% of follow-ups. The other billed 99233 on 9% of follow-ups, compared with about 49% nationally. If both providers’ share of high-level visits had matched the national pattern, that sample alone would have carried about 360 more work RVUs. A pattern like this is a reason for review, not proof of a coding error, so the next step is a documentation review to confirm whether the notes support higher levels before anything changes.
Read the signals before you act on them
A low distribution doesn’t prove underbilling. It can reflect patient mix, the kind of shifts a provider works, or documentation that doesn’t support a higher level. That last case is still worth finding, because the fix is documentation, not coding.
A distribution well above peers is a compliance review trigger. The note doesn’t travel with the claim. When a payer questions a code, it requests the records later, and if the documentation doesn’t support what was billed, that provider can end up on targeted prepayment review, with claims held for records before they pay. The goal is accuracy in both directions: every visit billed at the level the documentation supports, no higher and no lower.
Accurate documentation helps beyond billing. Readmission and mortality measures are risk-adjusted, so when a note understates how sick a patient was, the group’s quality numbers look worse than the care it delivered.
From the numbers to a short coaching list
The output of all this should be a short list of providers who need coaching. For each provider on it, I’d start with:
- Education on the 2023 rules, including when time rather than MDM supports the higher level, and what counts as critical care.
- Documentation feedback on a sample of their notes, so the provider sees exactly what supported, or didn’t support, the level billed.
- Targeted coder review of that provider’s charges for a defined period.
- Catching it before the claim goes out, while there is still time to correct the level, rather than after the payment arrives. The next post in this series covers that pre-billing window.
Education works best when it’s short and specific. The CEO of a large infectious disease group described her approach to diagnosis coding: “I’ve been doing a lot of educating the providers in terms of their code selection. And I’ve given them the top 10 ‘just say no’ list.” The same approach works for E/M levels: a few clear examples your providers see every week.
When I sketched what a medical director’s view should look like, I built it around one question: how are my clinicians doing, and who needs coaching? It shows the group’s split across levels for admissions, follow-up visits and discharges, then each provider’s follow-up split, flagged when it sits far from the group’s own distribution in either direction. APPs are compared with APP peers, and nocturnists with other nocturnists. A short coaching queue lists the few providers furthest from target, because the middle of the distribution rarely moves a group metric.
How Charge Pro shows CPT distribution and wRVU trends
medaptus Charge Pro includes a standard report called E/M Distribution. Groups run it themselves for any date range, and it shows each provider’s visit counts by E/M code and level, with admissions, follow-ups and discharges in one view. It exports to Excel, CSV or PDF, so a practice manager or medical director can put providers side by side and compare them with the national figures above.
Where to start
Pull last quarter’s subsequent visits for your group and chart each provider’s split across 99231, 99232 and 99233. Then pick the two providers furthest from their peers and review five of their notes each. That review will tell you whether you’re looking at patient mix, documentation or level selection, and which of the coaching steps above to start with.
For the other metrics every owner should review monthly, see the previous post in this series: Revenue Cycle Metrics Physician Group Leaders Should Watch Every Month. Next: the window before RCM, where charge holds, charge lag and denials shape your cash flow. To see how medaptus Charge Pro supports hospital-based groups, visit our Physician Groups page.
FAQs
Can hospitalists choose the visit level by time instead of medical decision making?
Yes. Since 2023, hospital inpatient and observation visits can be selected by MDM or by total time on the date of service. For subsequent visits, the thresholds are 25 minutes for 99231, 35 minutes for 99232 and 50 minutes for 99233. Discharge day management is selected by time: 30 minutes or less for 99238, more than 30 for 99239.
How do you correct underbilling without encouraging upcoding?
Measure distribution in both directions, compare providers with similar patients, and focus coaching on documentation and rule education rather than target percentages. Review high outliers with the same care as low ones.
When can a hospitalist bill critical care instead of a subsequent visit?
When the patient has acute impairment of one or more vital organ systems with a high probability of life-threatening deterioration, and the provider spends at least 30 minutes of critical care time on that date. The patient’s location, including the ICU, doesn’t determine it. Confirm the documentation requirements with your coding team and your EHR’s note templates.

About The Author
Lisa Krueger, MSN, MBA, is an Executive Healthcare Advisor at medaptus. A former acute-care nurse practitioner, she has more than 15 years in hospital medicine and post-acute care operations leadership. Her work spans revenue cycle, value-based care, profit and loss (P&L)
Get the latest updates and news delivered to your inbox.
Subscribe to our newsletter today.